Tableau Training Course

Category :
Information Technology
20 Reviews :
4/5

Overview

This 5-hour Tableau Training course is designed to equip participants with the fundamental skills required to use Tableau, one of the most powerful data visualization and business intelligence tools available. In this compact yet comprehensive course, you will learn how to connect to various data sources, create dynamic and interactive visualizations, and build informative dashboards that convey valuable insights. By the end of the training, you will be able to leverage Tableau to analyze and visualize data effectively, making it easier to communicate findings and inform decision-making.

Course Introduction

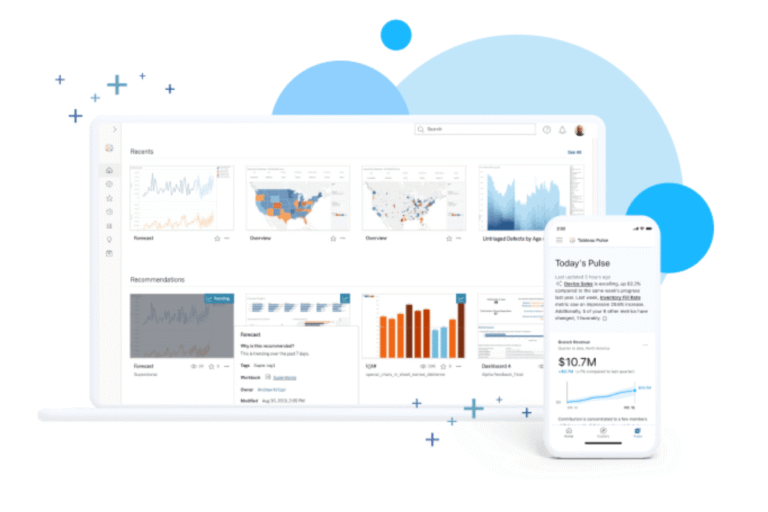
Tableau is a leading data visualization tool that helps individuals and businesses transform raw data into actionable insights through interactive and visually engaging reports and dashboards. It allows users to connect to multiple data sources, perform data analysis, and share insights in a visually appealing way. This course focuses on teaching you how to create powerful and interactive visualizations and dashboards that can be easily interpreted by both technical and non-technical stakeholders. Whether you’re working in data analysis, business intelligence, or project management, Tableau offers a wide range of applications to enhance decision-making processes.

Learning Objectives

By the end of this Tableau Training, participants will be able to:

Understand Tableau’s Interface and Features

Navigate Tableau's interface and get comfortable with its essential features.

Connect to Data Sources

Learn how to connect Tableau to different data sources, including databases, spreadsheets, and web data.

Create Basic Visualizations

Master the process of creating basic visualizations such as bar charts, line graphs, and pie charts.

Build Interactive Dashboards

Learn to build interactive and user-friendly dashboards that allow users to drill down into data.

Data Transformation and Preparation

Learn techniques for cleaning, transforming, and preparing data for analysis within Tableau.

Advanced Features

Gain insight into more advanced features of Tableau such as calculated fields, filters, and aggregations.

Publish and Share Dashboards

Learn how to share your Tableau workbooks and dashboards with others, both within and outside of your organization.

Design for Effective Communication

Understand the principles of good data visualization design to create clear and impactful visualizations.

Importance with Regards to Diverse Industry Sectors
  1. Finance:
    • In finance, Tableau is used to analyze financial data, track performance, monitor cash flow, and forecast future trends. It helps financial analysts build interactive dashboards to present complex financial data in a simple and clear manner.
    • Benefits:
      • Better financial performance tracking and analysis.
      • Enhanced data-driven decision-making.
      • Real-time financial reporting and forecasting.
  2. Healthcare:
    • Healthcare professionals can leverage Tableau to analyze patient data, monitor health trends, and optimize hospital operations. By visualizing key metrics, hospitals and healthcare organizations can improve patient care and resource allocation.
    • Benefits:
      • Data-driven insights into patient outcomes and hospital efficiency.
      • Enhanced reporting for medical research and patient care.
      • Real-time monitoring of key health indicators and trends.
  3. Retail & E-commerce:
    • Tableau is commonly used in retail and e-commerce for customer segmentation, sales analysis, inventory management, and marketing performance tracking. By visualizing consumer behavior, retailers can optimize product offerings and improve customer experiences.
    • Benefits:
      • Improved sales performance analysis and forecasting.
      • Better understanding of customer behavior and preferences.
      • Enhanced decision-making on product inventory and marketing strategies.
  4. Marketing:
    • Marketing professionals use Tableau to analyze campaign performance, customer demographics, and marketing ROI. With Tableau, marketers can create visual reports that make it easier to present complex data to stakeholders and optimize strategies.
    • Benefits:
      • Enhanced campaign performance tracking.
      • Better customer segmentation and targeting.
      • Streamlined reporting and visual communication of marketing efforts.
  5. Education:
    • Tableau is used in educational institutions to analyze student performance, optimize resource allocation, and track operational efficiency. Educators and administrators can use Tableau to create insightful visual reports on academic progress and institutional metrics.
    • Benefits:
      • Better tracking of student performance and outcomes.
      • Optimized resource allocation and curriculum management.
      • Efficient data reporting for stakeholders, including parents and educational boards.
  6. Manufacturing:
    • In manufacturing, Tableau can be used to analyze production data, track quality control, and monitor supply chain operations. Manufacturers can improve operational efficiency by visualizing performance and identifying bottlenecks.
    • Benefits:
      • Enhanced production and supply chain monitoring.
      • Real-time visibility of production efficiency and quality.
      • Optimized resource and inventory management.

Tableau expertise opens up a variety of career opportunities across multiple industries. Some common career options for individuals skilled in Tableau include:

  1. Data Analyst:
    • Role: Analyze large datasets and create visual reports to help businesses make data-driven decisions.
    • Industries: E-commerce, finance, healthcare, education.
  2. Business Intelligence Analyst:
    • Role: Use Tableau to design, analyze, and deliver reports and dashboards that assist in decision-making and strategy formulation.
    • Industries: IT, finance, manufacturing, retail.
  3. Data Scientist:
    • Role: Utilize Tableau in combination with statistical models to uncover insights from complex data and build predictive models.
    • Industries: Technology, finance, healthcare, retail.
  4. Marketing Analyst:
    • Role: Track and analyze marketing campaign performance and customer data to drive targeted marketing strategies.
    • Industries: E-commerce, media, retail, advertising.
  5. Financial Analyst:
    • Role: Use Tableau to analyze financial data, forecast trends, and monitor key financial metrics.
    • Industries: Banking, insurance, corporate finance, investment.
  6. Product Manager:
    • Role: Leverage Tableau to monitor product performance, gather user feedback, and inform product strategy and development.
    • Industries: Technology, retail, e-commerce.
  7. Operations Analyst:
    • Role: Use Tableau to analyze operational data, identify inefficiencies, and support process improvement initiatives.
    • Industries: Manufacturing, logistics, supply chain.
  8. Consultant (Tableau or Data Analytics):
    • Role: Provide Tableau-based data analysis and reporting solutions to businesses, helping them improve processes and make informed decisions.
    • Industries: Consulting, technology, IT services.
  9. Supply Chain Analyst:
    • Role: Monitor and analyze supply chain data, ensuring that operations are running efficiently.
    • Industries: Retail, manufacturing, logistics.

Current Trends

Increased Data-Driven Decision Making

As more organizations embrace data analytics, the demand for professionals skilled in Tableau and data visualization is on the rise. Tableau’s user-friendly interface and powerful analytics capabilities make it a go-to tool for many companies.

Integration with Other Technologies

Tableau is increasingly being integrated with cloud platforms like AWS, Google Cloud, and Microsoft Azure, which is expanding its use in cloud-based analytics.

Real-Time Dashboards

There is growing interest in real-time data visualization, and Tableau’s ability to work with live data feeds is making it a key tool for industries that require up-to-the-minute insights.

Future Trends

Growth of Business Intelligence (BI)

As businesses continue to prioritize data analytics, the role of BI professionals skilled in tools like Tableau will continue to expand.

Advancements in AI and Machine Learning

Tableau’s integration with machine learning tools and AI will allow professionals to create predictive analytics dashboards and explore new areas of data insights.

Expansion into New Industries

Industries such as healthcare, manufacturing, and education are increasingly adopting Tableau for data analysis, opening up new job opportunities for Tableau experts.

Career Advancement Opportunities

Professionals with Tableau expertise may move into higher-level roles, such as Data Scientist, BI Manager, or Chief Data Officer, as the demand for data-driven decision-making grows.

In this Tableau training, you will gain the skills needed to excel in the world of data analytics and business intelligence. Whether you’re just starting or looking to sharpen your Tableau skills, this course will provide the practical knowledge you need to leverage data to drive impactful business decisions.

Apply Now

Your Contact Details